Newsletter Subscribe
Enter your email address below and subscribe to our newsletter

Enter your email address below and subscribe to our newsletter

It is easy to miss the Match Momentum graphic the Fox network stamps onto its World Cup broadcasts. The graph pops up only on rare occasion, wedged into the bottom-left corner, less than a third of the height and width of the screen. Often it appears only so briefly that the commentators never make a point to draw attention to it, or to try to explain what is happening within it. If advanced statistics have historically been created, 1) to produce better metrics for match analysis, and 2) for advertising, the Match Momentum graphic poses a new, intriguing third option: an advanced statistic simply for the sake of it.
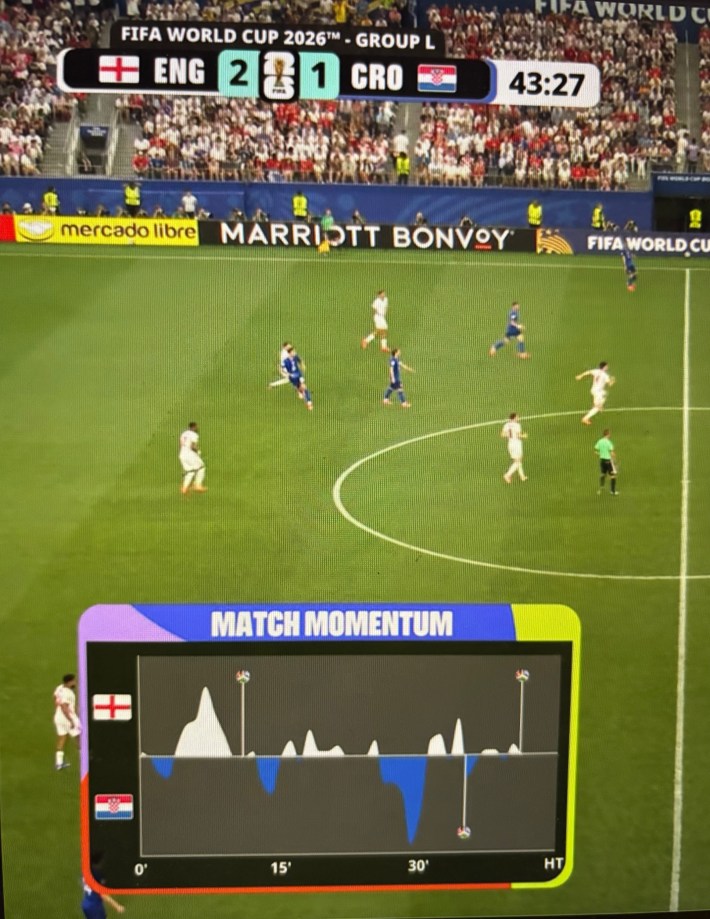
The “what” of Match Momentum is easier to grasp than the “why.” It is a statistic provided by Stats Perform/Opta, a sports data and AI (presumably in the machine-learning sense) company, that provided a full explainer. The graphs can also be found on the stats pages of the BBC and FlashScore, presumably using Opta’s model, though the BBC and the Fox broadcast, diverging from modern broadcast conventions, do not come along with a helpful plug for their source.